Touch Me Viz: Hands-On Data Physicalization @ Makers’ Lab
E3UDRES2 & DIHOST Workshop
Level: Beginners
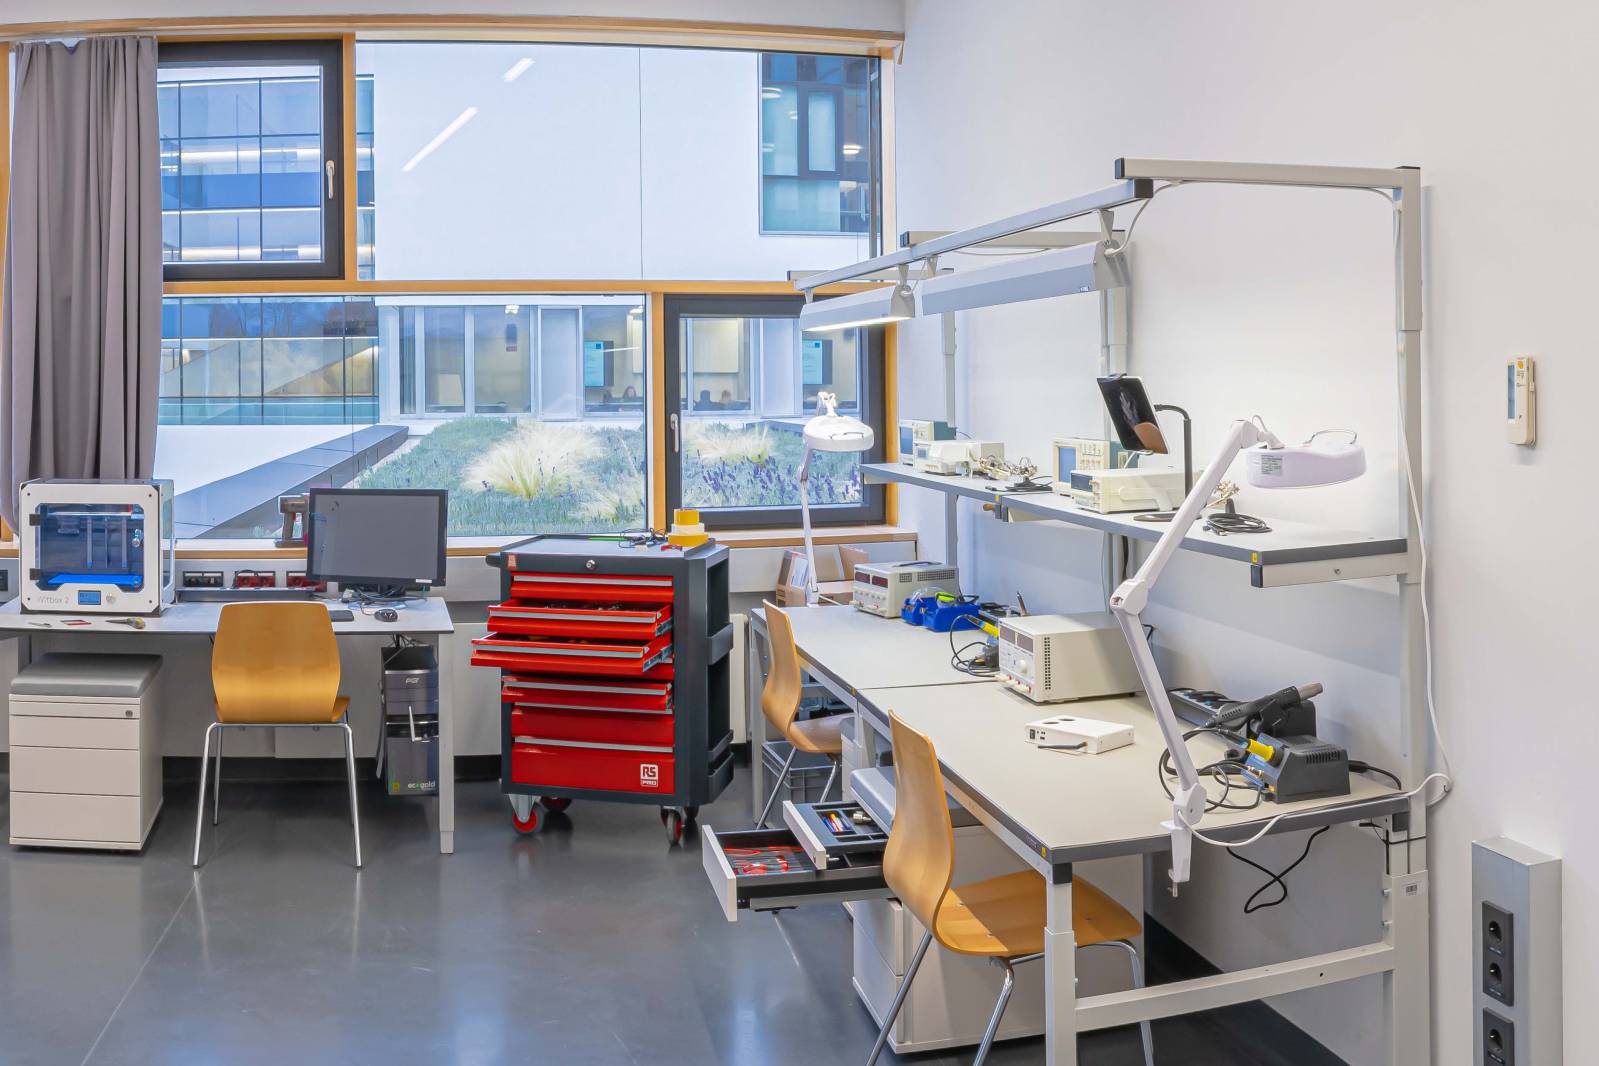
Location: St. Pölten UAS - A.1.03a Industry Lab & A.1.03b Makers' Lab (Building A)
Workshop description:
In our information age, data is one of the most valuable assets for economy, science, and society. The amount of digital data available to us is skyrocketing at an increasing pace every year. Data visualization, i.e., turning data into pictures, has proven to be very well suited to support humans in making sense of data.
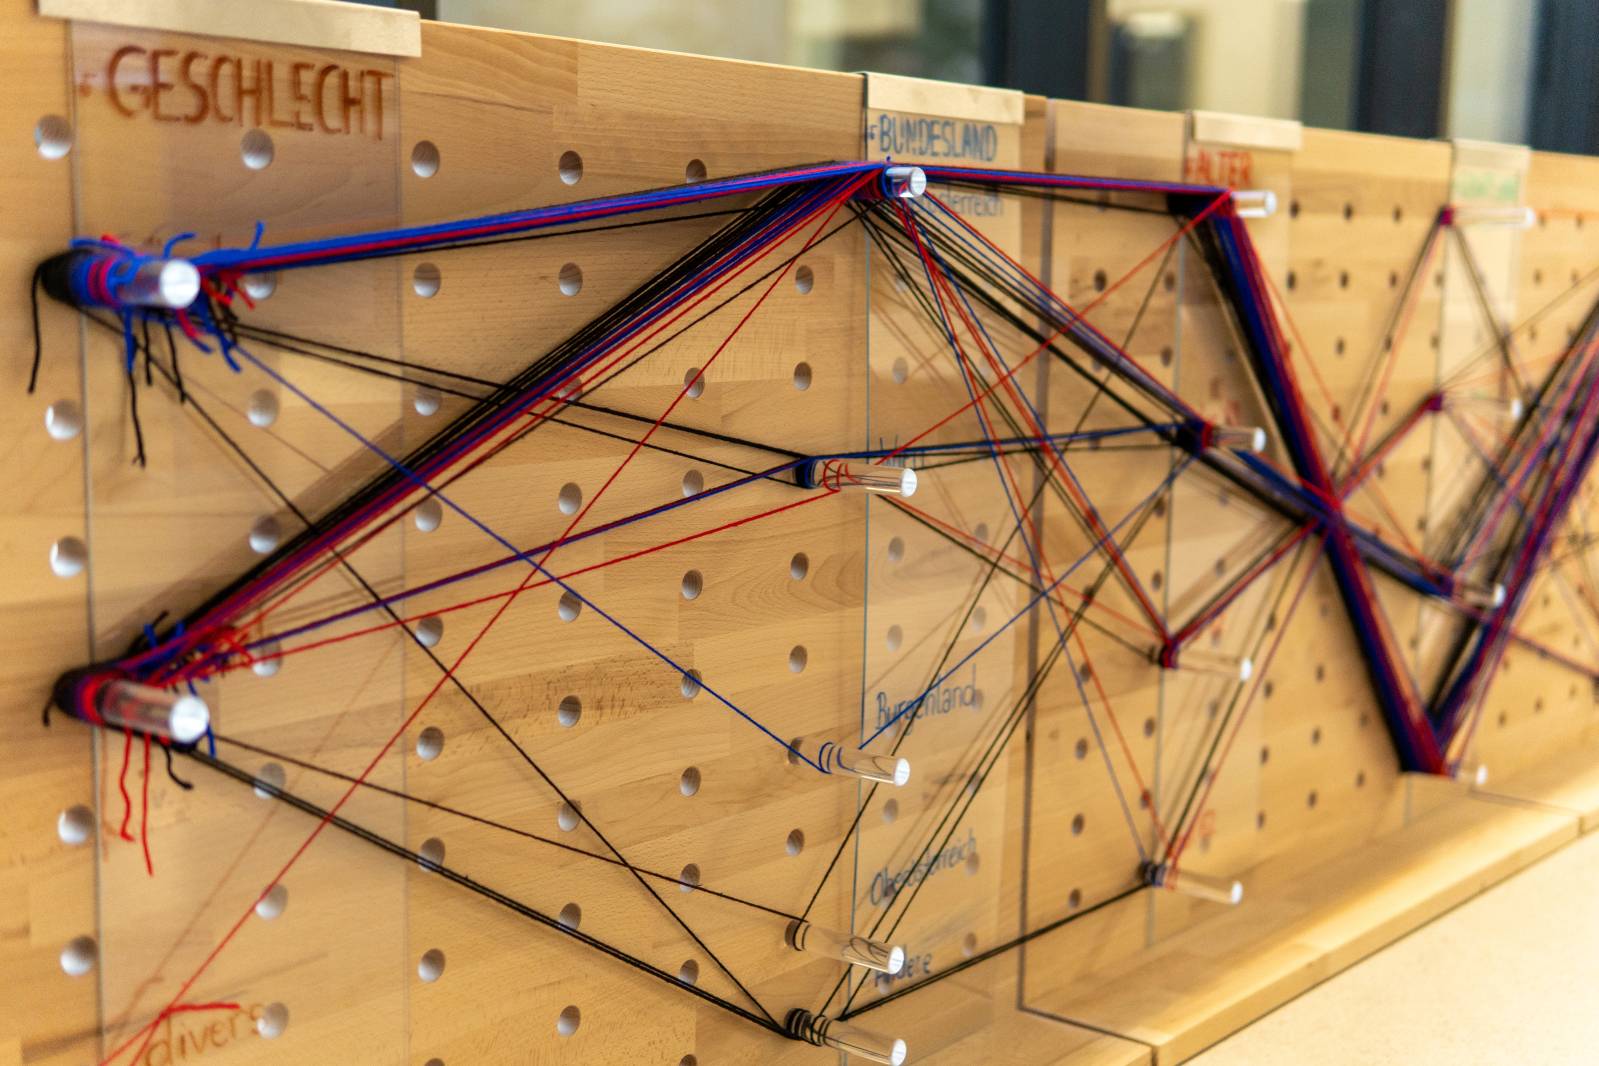
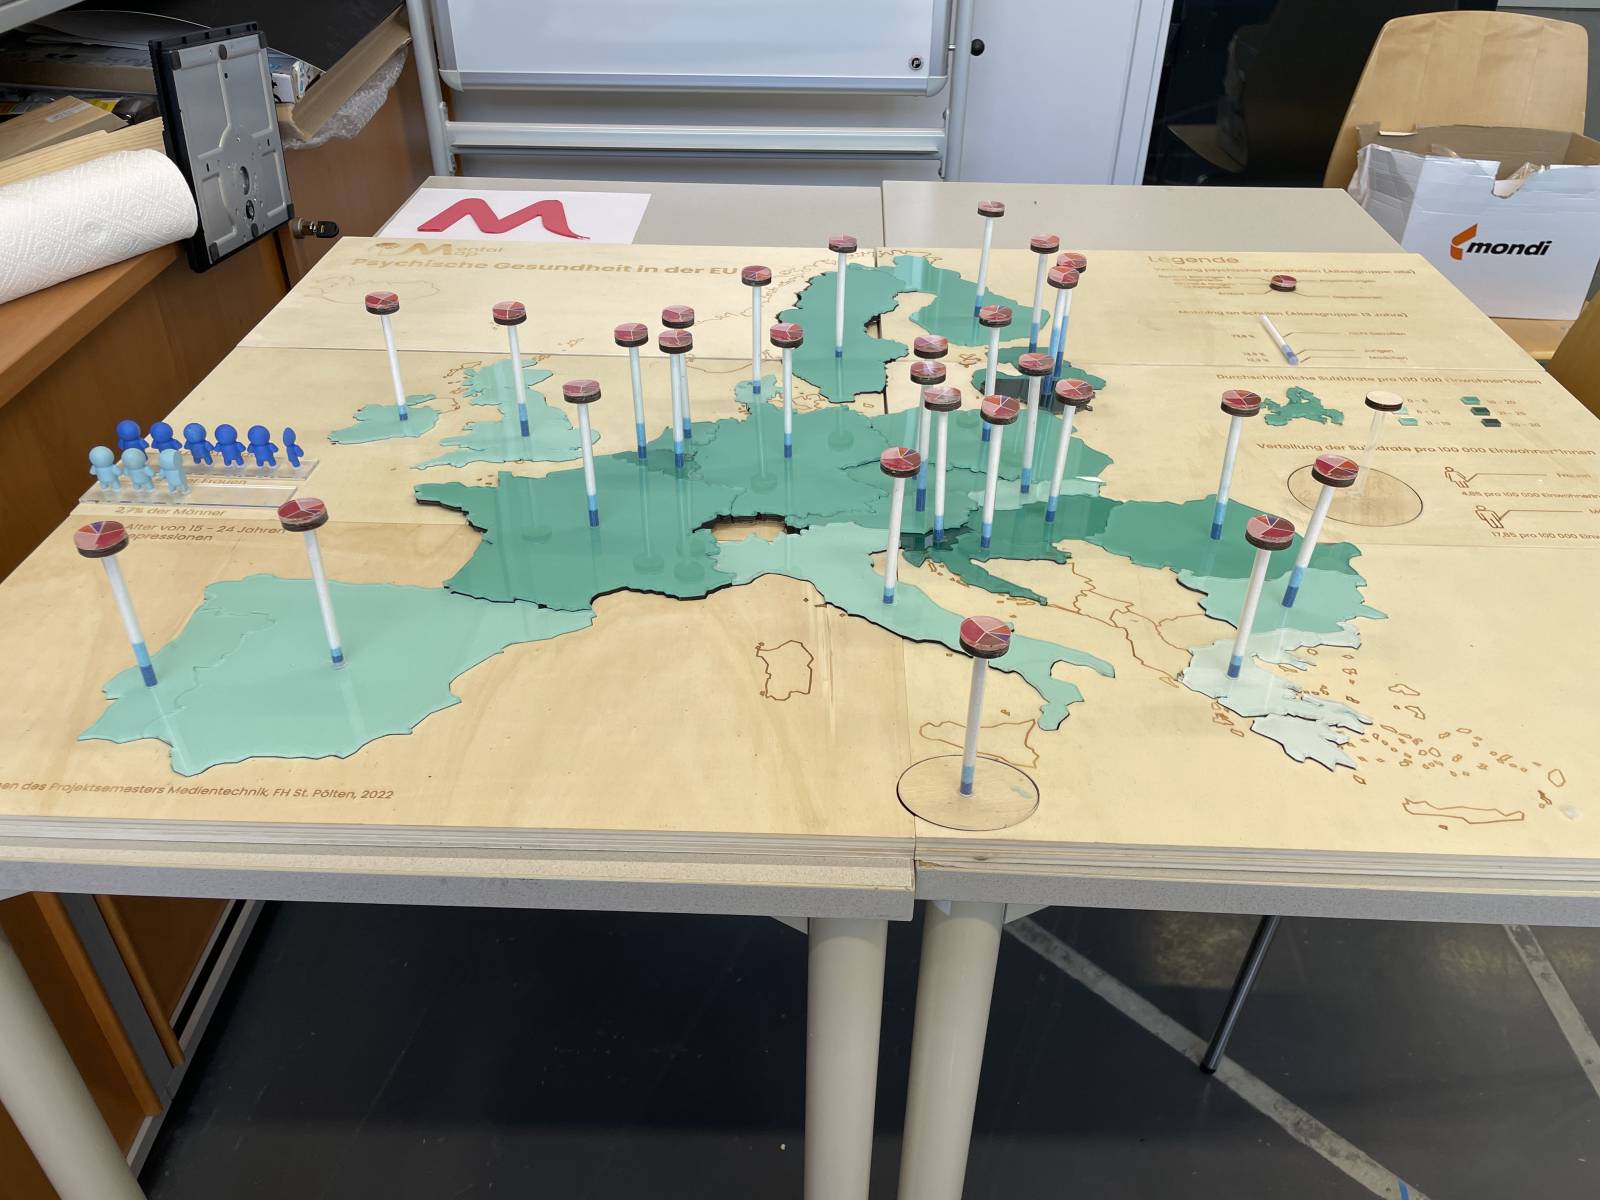
But data visualizations are primarily produced and consumed on paper or digital media. Perceiving these representations is mostly limited to our visual sense and constrained by the projection on flat surfaces. Using physical space and objects that represent data allows for even richer experiences that tap into the power of our tactile senses and spatial orienteering capabilities in addition to our visual perception.
Already in ancient times humans turned data into physical objects, such as calendars engraved into bones or tokens made of clay. With today's advances in digital fabrication tools like 3D printers or laser cutters, we have reached a completely new level of possibilities to produce physical objects that are based on digital data.
The aim of this workshop is to experiment with ways of transforming data into physical objects where data can be touched and felt. We will be using both handcrafted and digital fabrication tools (e.g., 3D printer, laser cutter, drills, scissors, knifes) as well as digital data tools (e.g., Excel, Tableau, Tinkercad) in concert to turn digital data into physical objects and sculptures using a variety of materials (e.g., acrylic, wood, cardboard, cork, PLA).
Please note:
This workshop will be primarily held in GERMAN (Non-German speaking persons might be able to participate, however, as slides and course materials will be provided primarily in ENGLISH.).
Requirements:
- Basic MS Excel skills
- Basic knowledge of using a vector-based graphics editing SW (e.g., Adobe Illustrator, Inkscape)
- Enthusiasm for experimentation with crafting and making things
- Feel free to work with your own laptop and SW
 FH St. Pölten.jpg
)
 FH St. Pölten.jpg
)
 FH St. Pölten.jpg
)
 FH St. Pölten.jpg
)
Lecturers:
Christoph Braun
Christoph Braun is a lecturer, researcher and the technical supervisor of the Electronics, Makers' and Industry 4.0 laboratory at the St. Pölten University of Applied Sciences Department of Media & Digital Technologies. Currently he is working to investigate concepts and methods for designing virtual transformations of practice teaching rooms in the field of distance laboratory lessons as part of his dissertation at the University of Vienna.
Wolfgang Aigner
Wolfgang Aigner is the scientific director at the Institute of Creative\Media/Technologies at the St. Poelten University of Applied Sciences, Austria and adjunct professor at TU Wien, Austria. He is an expert in Information Visualization (InfoVis) and Visual Analytics (VA), particularly in the context of time-oriented data. He performs research on concepts, methods, and software prototypes that support humans in dealing with large and complex information structures, to make them more comprehensible, facilitate exploration, and enable knowledge discovery. Wolfgang has authored and co-authored more than 135 peer-reviewed articles and is an author of the book “Visualization of Time-Oriented Data” (Springer, 2011 & 2023) that is devoted to a systematic view of this topic.
Supported by